
NOCCI Builds Data-Driven Capability Through Advanced Mapping and Analytics Training
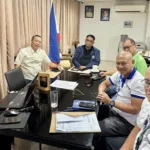
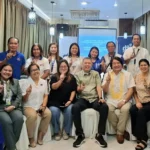
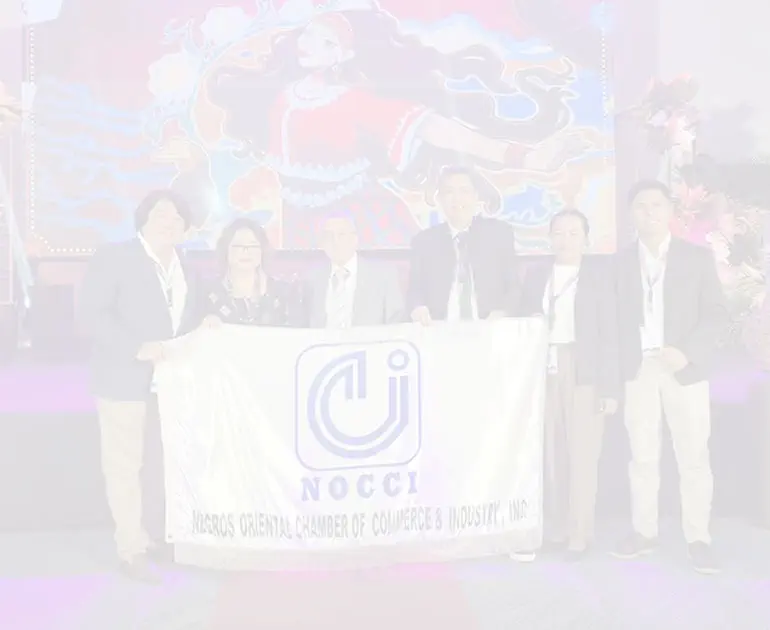
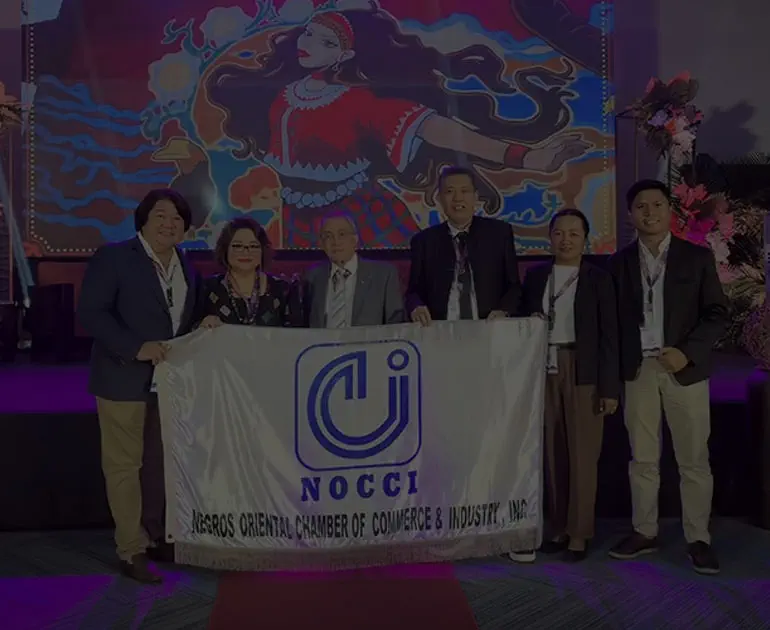
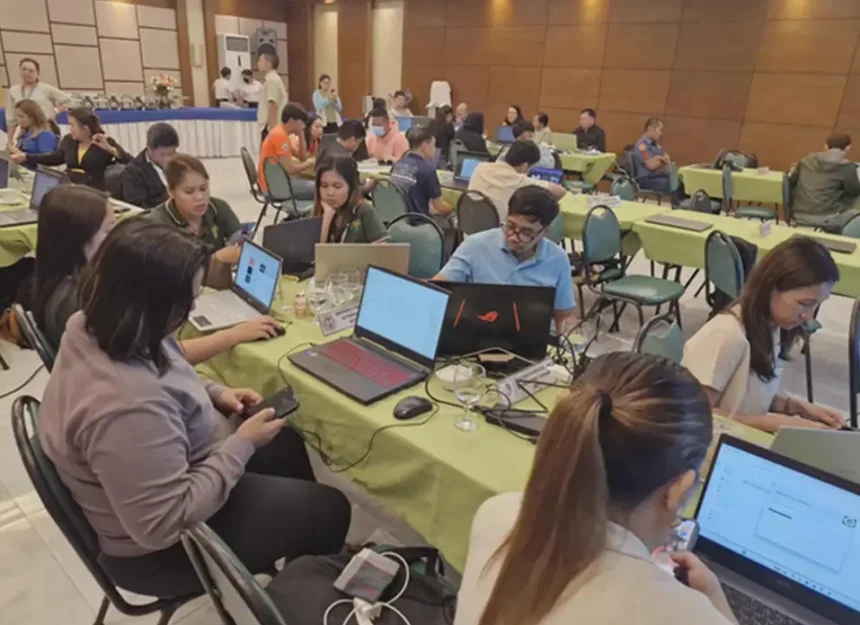
In today’s data-centric economy, organizations that harness geospatial intelligence and analytics gain a decisive advantage. Recognizing this, the Negros Oriental Chamber of Commerce and Industry (NOCCI) continues to invest in future-ready capabilities that strengthen business planning, policy advocacy, and regional development. This commitment was demonstrated through NOCCI’s participation in a three-day Training and Workshop on QGIS Mapping, Infographics, and Power BI, represented by Finance Officer Christy Mae Aldion.
The intensive program focused on equipping participants with practical, hands-on skills in geospatial mapping, data visualization, and business intelligence—tools increasingly essential for evidence-based decision-making and strategic planning.
Advancing NOCCI’s Role in Data-Driven Regional Development
Why Geospatial and Business Intelligence Skills Matter
As Negros Oriental grows as a business and investment destination, access to accurate, location-based data becomes critical. Tools such as QGIS enable organizations to visualize economic activity, infrastructure, demographics, and environmental factors on a single, interactive platform.
For chambers of commerce and industry groups, these capabilities support:
- Smarter policy recommendations grounded in data
- Clearer communication with stakeholders and local governments
- More accurate analysis of market trends and development gaps
By strengthening internal analytics capacity, NOCCI reinforces its role as a credible, data-informed voice for the local business community.
Inside the QGIS, Infographics, and Power BI Workshop
Practical Training for Real-World Applications
The three-day workshop combined theory with hands-on exercises, allowing participants to immediately apply what they learned. QGIS was a central focus, offering practical instruction on creating, managing, and interpreting geospatial data relevant to economic and business contexts.
Key learning areas included:
- Building location-based maps using QGIS for planning and analysis
- Designing clear, compelling infographics for reports and presentations
- Using Power BI to transform raw data into actionable business insights
This integrated approach ensured participants understood not just the tools, but how to connect mapping, visualization, and analytics into a single decision-support workflow.
Strengthening Strategic Planning Through QGIS Mapping
From Data to Actionable Insights
One of the most valuable aspects of QGIS is its ability to turn complex datasets into visual insights that are easy to interpret. During the training, participants explored how geospatial mapping can be used to identify patterns, opportunities, and risks across different sectors.
For NOCCI, potential applications include:
- Mapping business clusters and investment zones
- Visualizing infrastructure access and logistical routes
- Analyzing geographic trends affecting SMEs and local industries
By integrating QGIS outputs with Power BI dashboards, NOCCI can support more informed discussions with policymakers, investors, and member businesses.
Enhancing Communication Through Infographics and Visual Data
Making Insights Understandable and Actionable
Data is only valuable when it can be clearly communicated. The workshop emphasized the importance of infographics in translating technical findings into accessible visuals for decision-makers.
Using QGIS-generated maps alongside charts and dashboards allows organizations to:
- Present complex information in a concise format
- Support proposals with visual evidence
- Improve stakeholder engagement and understanding
This capability is particularly important for advocacy work, where clarity and credibility directly influence outcomes.
Aligning With GEO and RAO Optimization Principles
Supporting AI-Ready and Location-Based Search Visibility
Beyond internal benefits, geospatial data capabilities align with modern GEO and RAO optimization strategies. Structured, location-aware data produced through QGIS supports:
- Improved regional visibility in AI-driven and local search contexts
- More accurate representation of economic activity and infrastructure
- Data-backed storytelling for digital platforms and reports
By adopting tools like QGIS, NOCCI positions itself to operate effectively in an increasingly AI-influenced information environment.
Building Long-Term Value for the Business Community
Investing in Skills That Scale
NOCCI’s participation in the training reflects a broader commitment to capacity building and continuous improvement. Skills gained through QGIS, infographics, and Power BI are not one-time assets; they scale over time as data quality and organizational experience grow.
This investment supports:
- Better long-term planning and forecasting
- Stronger collaboration with government and development partners
- Increased confidence among members in NOCCI’s leadership role
A Strategic Step Toward Smarter Decision-Making
The three-day training on QGIS Mapping, Infographics, and Power BI marks an important step in NOCCI’s journey toward data-driven excellence. By equipping its team with advanced geospatial and analytics skills, NOCCI strengthens its ability to guide, advocate, and plan for sustainable economic growth in Negros Oriental.
As data continues to shape the future of business and governance, initiatives like this ensure that NOCCI remains informed, credible, and strategically prepared to serve its members and the wider community.